
Hi, in this post I would like to present my approach in the estimation of cryptocurrency prices.
After getting in contact with Bitcoins somewhere in 2016, I was fascinated by the high volatility of cryptocurrencies. Especially as a consultant in the banking-insurance-industry, where a stock-jump of 2% in one day could trigger euphoric feelings, I was pretty enthusiastic to analyse whether the high jumps in these coins where somehow predictable. To describe the hype in Bitcoin you shall just remember the famous citation from “Back to the future”:

But yeah…I obviously was not the only person who wants to earn money via Bitcoin. No one wants to do investments where you loose money. But…is this really correct? I think yeah. It is. But it is really important to realise that not all people investing money to gain profit do this on a reasonable basis. In Germany, there is the saying: “Gier frisst hirn.”, basically “Greed eats brain.”.
I think investing in cryptocurrencies can be summarized as follows: Everybody wants to earn money, but not everybody is using their brain to do so. In Figure 0 I prepared a little plot to explain this fact.

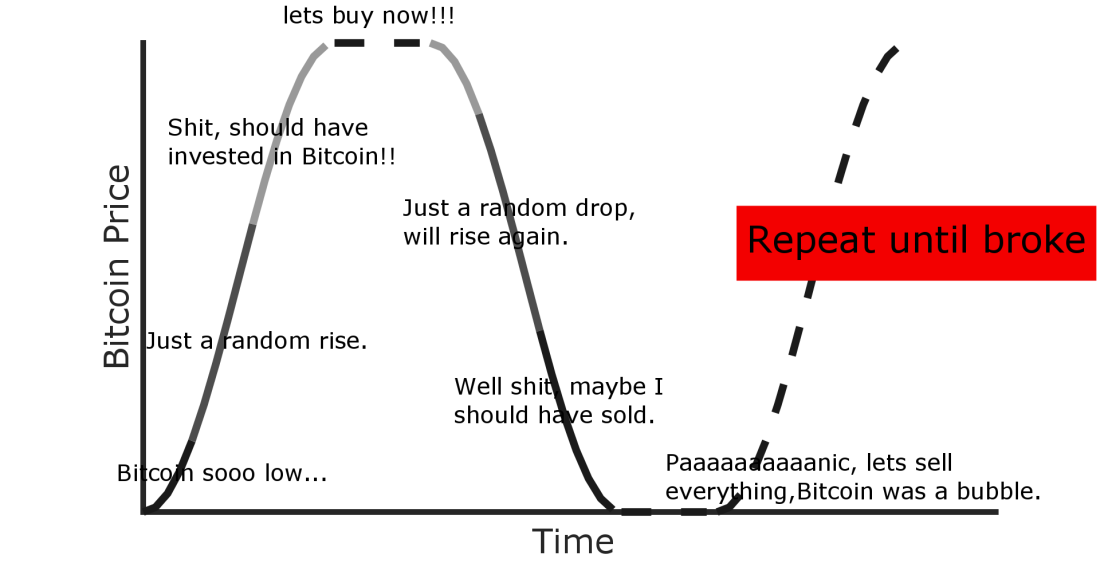
If you invest in Bitcoin, you should invest before a rise in the Bitcoin-price. I know, there is no safe way to assume it should rise. But if your only evidence of a future rise is that it already rised by 20 % or even 30 %, then you should definitely not buy.
The question is, how can we predict cryptocurrency prices on reasonable basis. In the following sections I will present my approach to predict cryptocurrency prices. I tried to give a summary of my method and neglected the technical parts so that every reader should be able to understand the method. I also created an Appendix where I explain some basics which I think you should know when You are interested in cryptocurrencies.
Simple Long short-term memory (LSTM) approach
A LSTM-neural network is a network created to recognise pattern in a set of data. If you never heard about LSTM, you can imagine it as a blackbox where you enter a bunch of data and the blackbox then tries to identify patterns. There is a nice book by Christopher Bishop. Beside being a good introducten it has the advantage that is available for free. So if you got enough time it’s worth reading it.
One application of LSTM-neural networks is time series prediction. This just means that you fill historic cryptocurrency price data in the LSTM and the output is the price in the future. It is designed in a way that it adjusts it weights in a way that it „forgets“ unimportant events and focuses on hidden patterns in the data. It is a shame that I put the word „Simple“ in the beginning of the headline because a LSTM-neural network is anything but easy. But the reason I used the word „Simple„ is another-one. In the web you can find quite a lot about time-series prediction for coins based on historic price data, e.g. in this blog which I liked a lot. „Simple“ LSTM shall represent the fact that most of the people using LSTM-neueral network to predict cryptocurrency prices only take historic PRICE-DATA for the prediction of future cryptocurrency prices. Predicting future prices based on historic prices is also the point where I started from.
There are a lot of sources in the web where you can get historic price data of cryptocurrencies. The most-known is coinmarketcap. If you are a more experienced user it has alot of advantages to use an API (e.g. Poloniex) to get data instead of just checking it on a webpage. An API enables you to specify the data you are interested in. I added an extra section about APIs in the appendix.
As we know now that LSTM-neural networks exist and how to get historic price data, let us start with prediction cryptocurrency prices. Let us assume we are at a time t and want to predict the price of a certain coin at time t+1. Therefore we first have to train our network that it can predict prices given historic data. The training of an LSTM-neural network is represented in Figure 1.
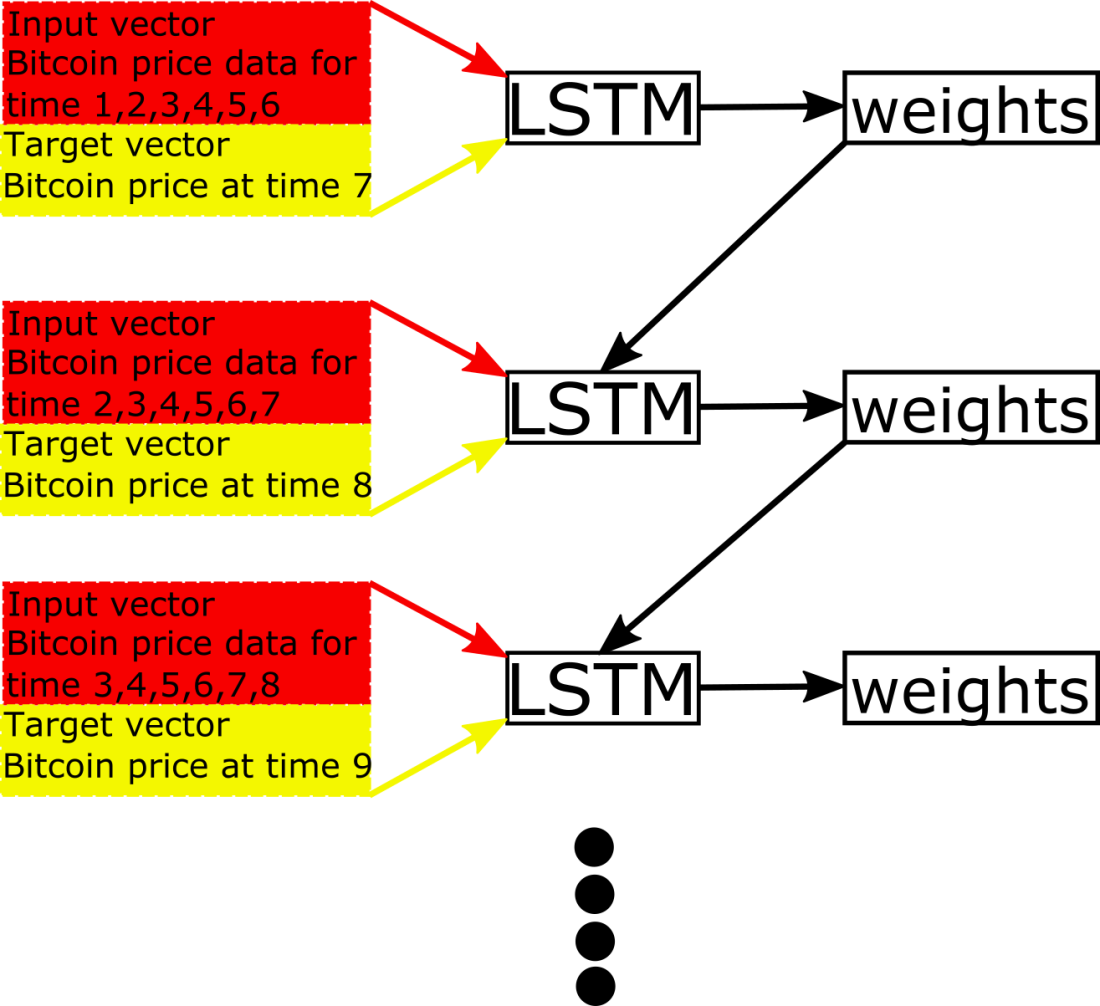
You have an input vector consisting of historic price data until time t. The prices are usually provided as candle information. Now you define a target vector as the price at time t+1. This means that you „show“ the LSTM-neural network historic price data and tell the network what the „result“ of the historic prices was. The word „result“ means the cryptocurrency price based on previous prices. Training a network requires a huge amount of data. After collecting enough test data you can start training the network and let it do its magical stuff. Maybe this sounds a bit silly when I write „magic stuff“, but I think that less than 1% of the people using LSTM or any other neural networks have an idea about what exactly the network is doing. But it is not important to understand what the network is doing, it is important that the prediction works. Therefore we test the performance of the LSTM-neural network. Obtaining a good policy for price-prediction is what we want, not understanding neural networks. When the training of the network is finished – this means the network calculated the weights – one can start predicting cryptocurrency prices. What is important now is to quantify the performance of our network. Quantifying its performance is denoted as testing. For testing purpose it is crucial to use „another“ dataset than the one used for training because otherwise the results are triggered. In testing you just provide input and target vectors again and compare the predicted value to the target value. A good approach is to use the median of the absolute normalized error MANE between the predicted price and the correct (target) price. This is the way I started to predict cryptocurrency prices.
The one timestep-predicted prices obtained via a „Simple“ LSTM-neural network where the training-data only consisted of Bitcoin-candle-data are represented as the red curve in Figure 2. The true prices are represented as the blue line.
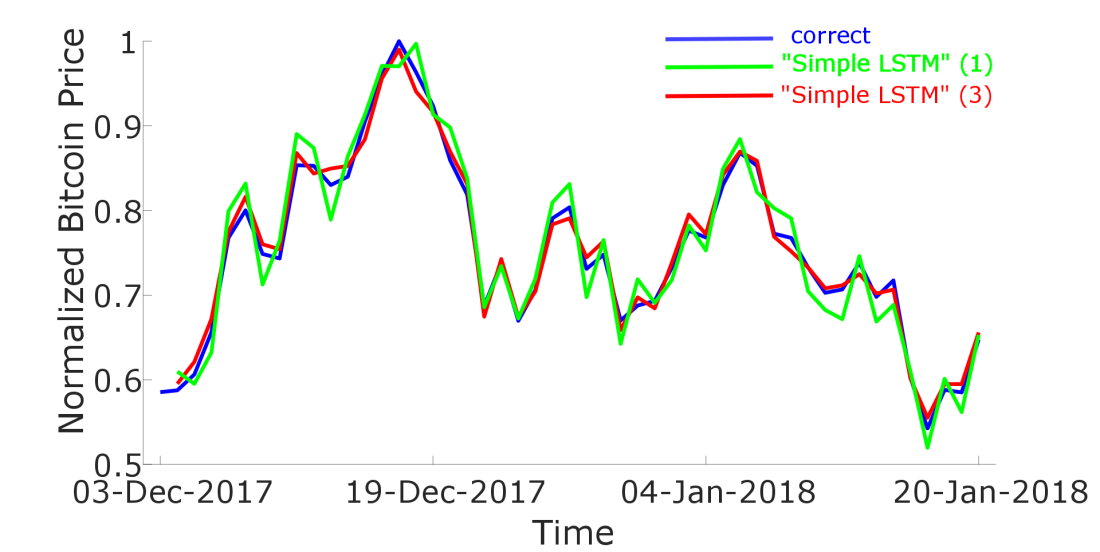
We see that there is a good accordance between the true and the estimated price. But you have to take into account that for the price-prediction for time t+1 we took into account historic price data including time t. This may make look the results better than they actually are. The worst performance of such simple LSTM-neural networks occur when there is a large rise or drop in bitcoin price. First I thought this problem vanished when I include a larger number of cryptocurrencies in the input vector. My hope was that the reason for a large rise/drop was somehow hidden in the prices of other cryptocurrencies. And indeed, when I include not only Bitcoin, but also Ripple and Ethereum in the input vector the results get better (See magenta curve in Figure 2).
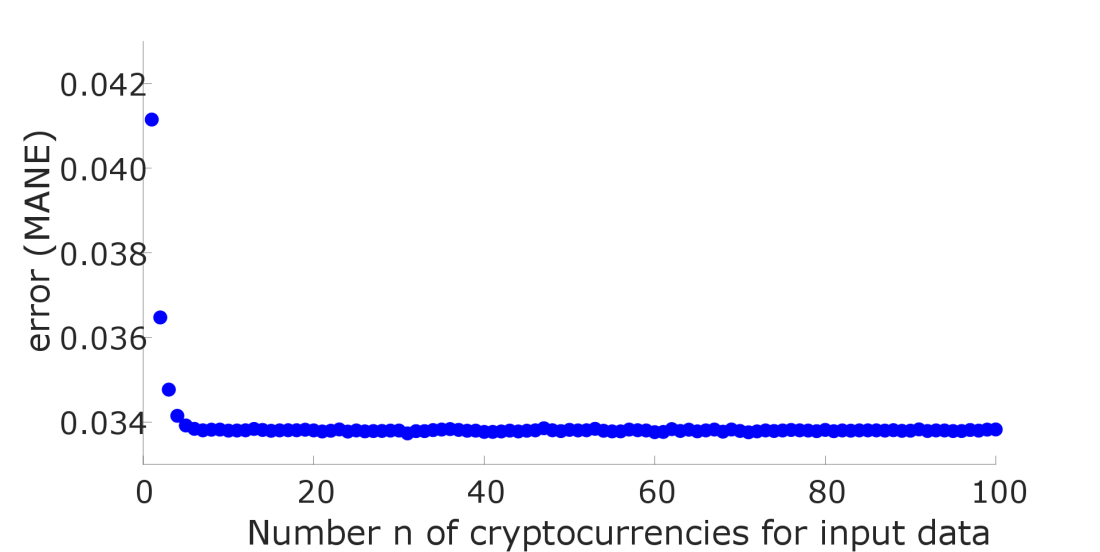
These results first made me optimistic that an increase of cryptocurrencies in the input vector leads to a better performance in the estimation of cryptocurrency prices. Unfortunately this performance saturates after a certain number of coins, as shown in the following Figure 3. On the x-axis you see the number n of cryptocurrencies I included in the input vector, where n represents the cryptocurrency-position regarding their importance based on their market-cap.
After getting the results from Figure 3 I already spent a lot of time in this Cryptocurrency-Price project and was sad that it seemed I was running in a dead end. I was thinking about what data I could include to the input vector to improve the performance. Finally I had the idea to somehow include the news, but had no idea how this could even work. You somehow have to quantify the news, but I had no idea how to do so. After some research I read about sentiment-analysis and immediately knew that this could be the solution.
Sentiment analysis
The approach making price prediction based on sentiment analysis is completely different to timeseries-prediction. In sentiment analysis you try to quantify the impact of news (Newspaper, Twitter, facebook, reddit,…) to make a prediction for cryptocurrency prices. The problem is that data can be pretty expensive and at the beginning I decided to use free-available data. I found the page newsnow.com where you get the headlines of crypto-related news and I started out evaluating these data. The question is how to efficiently analyse these headlines and I finally came up to the following idea.
In the following Figure 4 you see Bitcoin-price data as the blue line.
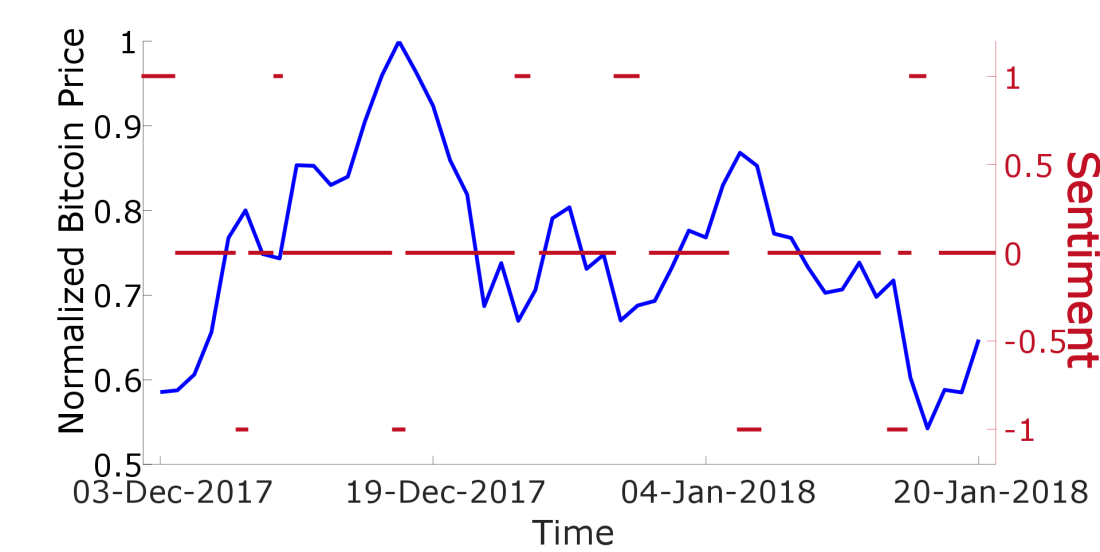
There are certain rises/drops in there and a good sentiment analysis should give me data like the red curve, where 1 represents BUY, 0 represents NEUTRAL and -1 means SELL. In this example the red curve was created manually. I wanted you to show how approximately the results of a good sentiment-analysis should look like. I was thinking about how I could calculate the red curve based on the news and finally came up with the following idea: There has to be a certain combination of words in the headlines before a rise/drop and this has somehow to be quantified to get the red curve. As a simple example you can think that before a rise in Bitcoin price the words „Bitcoin“ or „BTC“ will occur more frequently than compared to other times. This is obviously true but unfortunately this is also true for a drop. In a next step you could think that the words „Bitcoin“ and „Rise“ should occur more often to indicate a rise. But this is also not true in general because there could be headlines like „Bitcoin drops hard, Ethereum Rise“, what obviously not will indicate a rise in Bitcoin price.
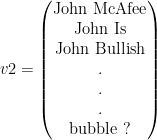
Finally I came up with the following, computational intensive idea. Assuming we are at time t and want to calculate the sentiment for time t+1 determining whether we should SELL, BUY or HOLD Bitcoin. I take into account all single words and punctuation marks (denoted as strings) which have been used in the headlines until time t. This is a huge amount of strings and I write them as a vector. Assume the following three headlines:
John McAfee Is Bullish on Bitcoin
Bitcoins no place for average investors
Bitcoin is a bubble?
My vector v1 would look like

Every word (denoted as string) occures one times in the above vector, and also punctuation marks are important! But it is important how these words come together. Therefore I create the vector v2 based on vector v1 in the following way. The vector v2 is a combination of two words of vector v1. The first entries would be
And I create a third vector v3 which is basically the same as v2 but where the words are separated by a slash, meaning

This can be continued….
We have to define a time range in which we take news into account. Let us say for getting the sentiment at time t we take into account the news between (t minus one week) and t.
Now we count how often the words of vector v1 occur in the news in the specified time region and write this number in the corresponding row in a vector denoted as iv1. Based on vector v1, the vector iv1 would start as follows:

That would mean that the word „John“ occured 3 times, the word „McAffee“ occured 2 times, „on“ occured 5 times and „Bitcoin“ occured 10 times.
Based on vector v2 we check how often in a headline the first (John) AND the second (McAfee) word occurs and write this number it in the corresponding row of vector iv2. For the vector v3 we check how often the first word occurs in a headline BUT NOT the second word. We denote this vector as iv3_1 and to the same where the second word occurs BUT NOT the first one and denote the corresponding vector iv3_2. This can be done for more complicated vectors v but it will get computaionally pretty expensive…
Our input vector is now just the combination of the vectors iv1, iv2, iv3_1, iv3_2,… One could have endless discussions about why this approach works and as a Physician this looks for me like an expansion. The first vector iv1 gives you a basic overview about what is happening. The vector iv2 gives you deeper insight as it tells you which words belong together and so on…In future work one could somehow weight the vectors iv based on the exact time a word occurs in a headline. This means it could have more impact when it occurs at time t-1 as when it occurs at time t-10. But I had a long discussion with a friend about this topic. I think this should not lead to significant changes, becasue: We just take news into account in the timerange of one week. When we are at time t, the news at time t-7 are included, but when we are at time t+1, the news at time t-7 are excluded, leading to a decrease in the amount of occurences of this certain word. And this should be equal to weighting the words. But I would be happy to read your opinion on this.
Now I will describe how I choose the target vector. In Figure 5 you see a Bitcoin price chart represented as the blue line. The black (red) dot marks the position with the best opportunity to buy (sell) Bitcoin (based on some thresholds).
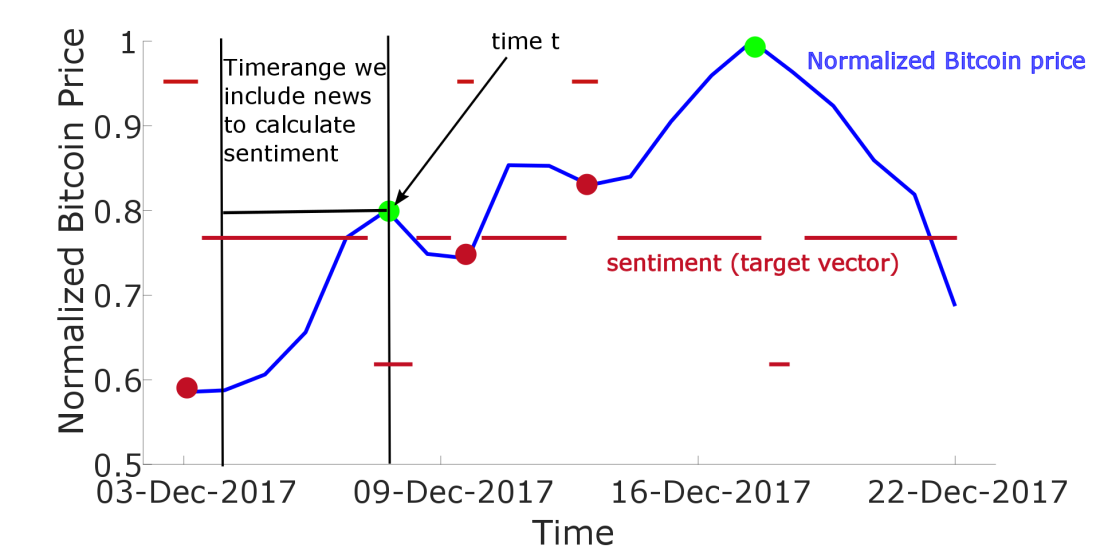
I define the target vector at time t as a scalar (scalar = number) which can be either 1, 0 and -1. When the target vector is 1, this means you should BUY Bitcoin. The value 0 indicates that you should not BUY or SELL and -1 indicates you should SELL Bitcoin. The target vector is represented as the redline in Figure 5 and I set this vector automatically based on the red and green points. At a certain time around the red point I set the target vector to 1 and at a certain time around the green dot I set it to -1. At all other times the target vector is 0.
Extended LSTM
Now you know how one could define an input and target vector to train your LSTM-neural network to give you a sentiment based on news headlines. To put everything together, I extend the „Simple“ LSTM-neural network. If you remember, I defined the „Simple“-neural network as a neural network which predicts crypto-prices ONLY on historic price data. This means the input vector consists of historic price data of one or more cryptocurrencies, as demonstrated in Figure 6 (a).
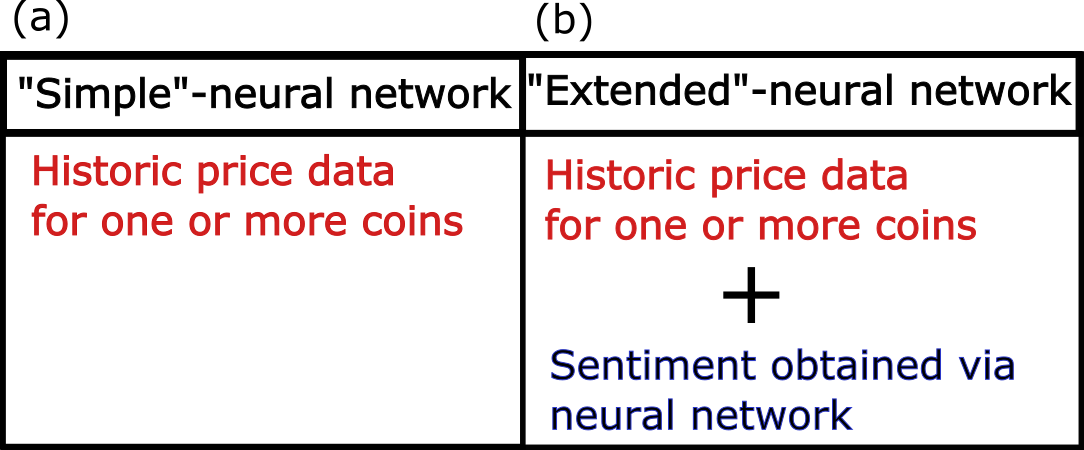
The „Extened“-neural network is based on the „Simple“ one. The difference is, that I extend the input vector by the sentiment value I got via another neural network as described in the previous section. An example for an input vector is given in Figure 6 (b).
Quantifying the results
Now that you know how I set up my „Extended“-neural network for cryptocurrency-price prediction you might be interesting tin its performance in comparison to the „Simple“-neural network. In Figure 7 I plotted the real price chart for Bitcoin in blue. The predicted (one timestep) curve for a „Simple“-neural network where we take into account the history of Bitcoin-prices is plotted as the red curve, the magenta curve represents the predicted price when we also take into account the price-history of Ethereum and Ripple. And finally, as the black curve, I present the results for the „Extended“-neural network. Therefore I only took into account the price history of Bitcoin. To calculate the sentiment I took into account the news of the past 10 days.
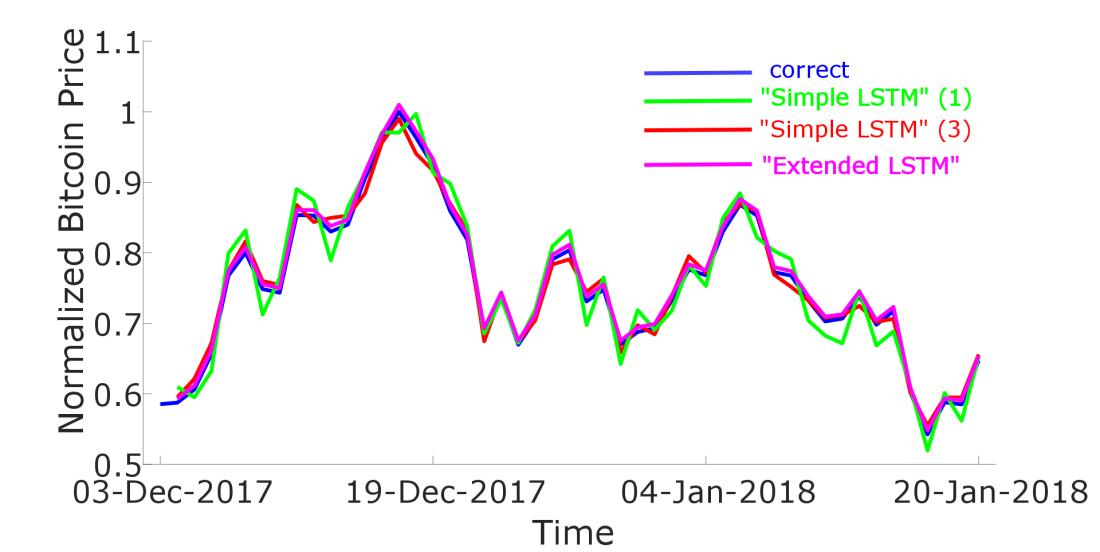
The performance for each method used in Figure 7 is given in the following table.
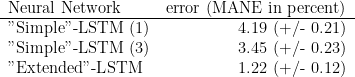
We see that the „Extended“-neural network performs way better than the „Simple“-neural network.
Conclusion & Outlook
To summarise, I introduced you to a powerful method for prediction cryptocurrency prices. Using a „Simple“-neural network – just taking into account price history – is a good first step to predict Bitcoin prices. The performance is good in case there are no big rises or drops in crypto-coin prices. If there are rises or drops the performance is worse. To solve this problem I extended the „Simple“-neural network to an „Extended“-neural network where I take into account the news. To quantify these news – resulting in a sentiment – I use another neural network. Combining historic price data and the sentiment results in a very good performance of the „Extended“-neural network.
You may ask why I need two neural networks and cannot combine them into one by simply combining the input vectors. This was my first attempt, but I got bad results. I think the reason is that the „important“ price information in the input vector (consisting of only 10 values) will not be recognized because there are thousands of other values in the input vector from the news-analysis. So I separated the two networks and just add one value – the sentiment – which is a very important input, to the historic cryptocurrency prices resulting in an “Extended”-input vector.
In future work I would like to extend my datapool. The problem is that new data can cost a lot of money, e.g. Twitter,Google,… Furthermore the computation takes a lot of time and could only be minimized by better Hardware. For the target vector of the sentiment analysis, currently consisting only of 1,0 and -1, I want to allow continous values between -1 and 1. But it is a challenging task to find a suitable method for the determination of the target vector.
If you would like to donate some coins to support my work, feel free to contact me 🙂
I hope to start soon a website to provide live data of crypto-coin prediction prices and sentiment.
I hope you liked this post. If so, please share and comment it. If you are interested to start a project, contact me!
Best regards, O.

Hey, thanks a lot for this nice post!! What other sources of news do you take into account beside the website you already mentioned? Im quite impressed by more than a doubling in the performance of your so called extended method. Did you use your data for a certain trading policy?
BR, Alex
LikeLike
I use this news API and also include tweets from Twitter. Quantifying twitter tweets is a lot more complicated than mentioned in the post above. Ill maybe start another post about this. Here are some ideas what you can do with Twitter.
I don’t use my data for an automated trading policy yet. As I mentioned I would like to start a webservice, which means I would have monthly costs and I hope for donations as I already invest a lot into this project 🙂
LikeLike
This is excellent! So, instead of predicting the exact Price, your Extended LSTM suggests when to BUY, HODL and SELL Bitcoin? Is my understanding correct?
LikeLiked by 1 person
Hey, thank You for the feedback and sorry for the late reply. Didn’t expect that much feedback, especially in form of mails. As I went back to university to do my PhD I have not an infinite amount of time to put into this Blog 😛
Your understanding is basically correct. My sentiment-LSTM calculates me a value which indicates whether to HOLD, SELL or BUY, as you said. And this sentiment-value is fed back as additional input into my main LSTM to predict Bitcoin price.
But for future work I would stop to predict future Bitcoin prices as an absolute value and would only give the output HOLD, SELL or BUY, as you said.
This could be refined by introducing more steps, such as:
2 = definitely buy
1 = likely buy
0 = hold
-1 = likely sell
-2 = definitely sell
This seems more promising to me.
Best regards, O.
LikeLike
There are more than 1600 cryptocurrencies up to now. Before applying and LSTM for each crypto, I would suggest to try a cluster analysis to group currencies in clusters. Once detected the clusters, you could try to predict each crypto based on past values of the related ones. Also a naive ARIMA model could suggest how many lagged values you should use in the LSTM as inputs. Sentiment analysis based on news is great, and could also use reddit/Twitter as posible sources. All of these could be improved using fundamental analysis, as taking into care things like number of contributors of each project, etc. Should you be interested, we could share info.
LikeLiked by 1 person
How do you use ARIMA to determine the best number of lagged values ?
LikeLike
Hi, thanks for the impressive article. I have a question about the sentiment part of the extended LSTM. For each time t, is that the v1, v2… may have different dimensions? And the word corresponding to the kth element of v1 in time t may different from that in the kth element of v1 in time t + 1? Did you feed these frequencies directly to the sediment model?
LikeLike
Hi, thank You for the feedback.
“For each time t, is that the v1, v2… may have different dimensions?”
It has the same dimension for all times. For a certain time T I check all the words which occured until this time T. So for times t<T new words occur, I cannot use them without a new training. But if a word doesn’t occur in a long time, it is very likely that it is not very important.
“And the word corresponding to the kth element of v1 in time t may different from that in the kth element of v1 in time t + 1?”
Regarding the answer of the first question, the ordering of words DOES NOT CHANGE.
“Did you feed these frequencies directly to the sediment model?”
I don’t feed the frequencies into the main network. I feed THE SENTIMENT obtained via this network in my main network.
BR
O
LikeLike
Hi, thanks for the quick reply.
“For a certain time T I check all the words which occured until this time T.”
Is that mean you are using a same limited vocabulary containing all the words occur in all the articles for all the time Ts?
“I don’t feed the frequencies into the main network. I feed THE SENTIMENT obtained via this network in my main network.”
I think I should be more clear about this. I mean, to get the ‘sentiment’, did you feed the frequencies to the sentiment model (not the main model) directly or use some technique like word vectors or ?
Thanks again!
LikeLike
Hi,
Thank you for an amazing post. Bookmarked and saved.
I have one question:
Did you normalize the entire data set or the training and test parts separately?
LikeLike